Results sections
By the time you write your results section, you’ve completed the hard work of data collection and analysis. This section focuses on describing your findings clearly and logically. Follow these tips to get your results section right.
The results section in a thesis is usually about describing your findings, not analysing or interpreting them. Depending on your thesis type, you may choose to present discussion and interpretation separately or integrate them differently.
As with all structural decisions, check your options with your supervisory team.
Contents of the results section
The results section in a HDR thesis generally contains statements of your results, and the analysis of them is then done in the following section, the discussion. In some theses, however, the two sections can be combined, as reflected in ‘Arrangement 2’ below.
The results section can, in fact, be arranged in the following three main ways with the first being most common.
| Arrangement 1 | Arrangement 2 | Arrangement 3 |
| Results | Results and Discussion | Results |
| Discussion | Discussion and Conclusion | |
| Conclusion | Conclusion |
Structuring your results section
First, remind the reader of the aims of the thesis which should have been made clear in the Introduction. It is acceptable to repeat the research question(s), hypothesis or research problem in this part.
- Example: The main research question for the qualitative part of the thesis was how cultural similarity, communication, learning and knowledge-experience facilitate the trust and commitment building process…
- Example: This study was conducted in response to the research problem resulting from students of Arabic at DLIFLC systematically scoring lower on their listening proficiency tests than on other language skills tests over five decades, indicating that listening comprehension has been … The study had three aims: …
- Example: This study examined how middle managers in student affairs use institutional logics to deliver student engagement opportunities for diverse students within their institutional structure and dominant logics that inform the field of student affairs. The study’s purpose was to explore how these middle managers, positioned as institutional actors who can affect student engagement experiences, navigate, resist, or create new institutional logics to serve the students not often included in dominant student development theories …
- Example: The purpose of this qualitative case study was to develop a realistic and deeper understanding of cultural norms that allow and perpetuate inequities among African American employees who work at California IOUs.
- Example: The purpose of this mixed study was threefold: (a) to investigate the effectiveness of using multimedia to teach two-word phrasal verbs to community-college ESL learners, (b) to investigate the motivation of community-college ESL learners learning two-word phrasal verbs actively by using multimedia, and (c) to study the relationship between ESL learners’ motivation and interest for furthering their learning.
Second, remind the reader of the method of data collection, recruitment to the study, and the study participants. This should not be a repeat of the methods section, but a quick recap of its key elements. This may include the following:
- Who were the participants?
- Why did you choose them?
- The composition (male/female; young/old; working/not working, etc) of the participants. Ages ranges and other uniquely relevant considerations given your study or experiment. How the participants were selected for inclusion/exclusion criteria.
- Example: Thirty-eight MEEs obtained from 24 children undergoing VTI for rAOM were assessed for the presence of extracellular DNA and live bacteria using generic nucleic acid staining and CLSM. Five children were female (20%) and the median age was 17.9 months (range 9.7–36.0 months; Table 1). All children enrolled in the study had received the 7-valent pneumococcal conjugate vaccine (Prevenar, Pfizer) at 2, 4 and 6 months of age as part of the Australian National Immunisation Program.
- Example: The recruited sample comprised of 275 participants, of which 70.2% were female (n=193). The average age of participants was 29.48 years (SD=12.56). Psychology students from NUIG (n=50) participated for course credit. Both a general population sample (n=148) and a student sample from University of Georgia (n=77) participated voluntarily. Participants indicated education completion to a primary (n=2), Leaving Certificate1 (n=30), Advanced Certificate (n=15), Ordinary Degree (n=24), Honours Degree (n=44), Master’s/Higher Diploma (n=62), PhD level (n=12), and unknown/not disclosed level (n=86). Two participants were excluded based on the inclusion criteria of age.
- Example: This review of literature encompassed a 10-year period from 2008 to 2018 and was conducted in August of 2018. The search included the use of Google Scholar, MEDLINE, and CINAHL databases. The original search terms included Nurs*, Reflect* AND Clinical OR Placement.
Third, you should objectively and dispassionately describe what you found. This part is best structured logically, following the same order as outlined in the procedure section of the methods where you describe the key steps undertaken in your study. Within each step, first state the most important finding and move to the next most important finding, and so on, as this table illustrates:
| Order of completion | Finding |
| First stage of analysis | Primary finding Secondary finding Tertiary finding |
| Second stage of analysis | Primary finding Secondary finding Tertiary finding |
| Third stage of analysis | Primary finding Secondary finding Tertiary finding |
Typically, figures and tables are used here. Figures can be histograms, scatter plots, radar diagrams or other devices; tables usually display numerical data in columns and rows. In general figures are used to demonstrate a trend; tables are used to show precise data.
To provide a visual representation of your results, first locate a figure or table in your text (e.g., ‘see Figure 1’), then state what the figure or table shows. This can also be done in the reverse order as shown in some of the examples above, i.e., first say what the results show then locate the figure or table. It is customary to provide a ‘lead-in’ sentence or sentence fragment such as ‘XYZ can be found in Figure 3 below’ or ‘Data for XYZ is provided in Table 7 above’. After locating the findings and providing a visual representation of the data it is necessary to comment on the findings (see below).
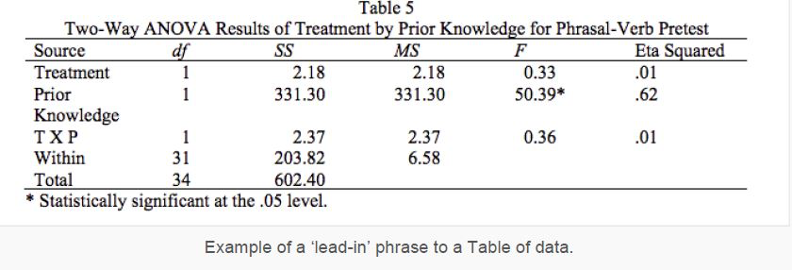
- Example: The results of the two-way ANOVA for treatment by prior knowledge for phrasal-verb pretest can be found in Table 5.
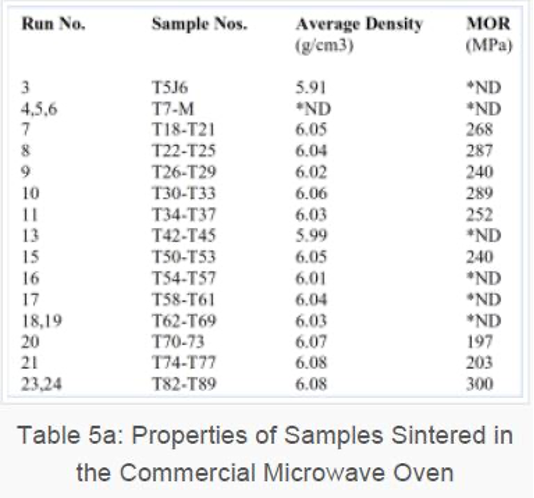
 Example: It was found that high density could be achieved (up to 99.6% of the theoretical density) in the commercial microwave oven. Results for the 3 mol% yttria zirconia powder are summarised below in Table 5a. No experiments were performed with 8 mol% yttria zirconia powder in this oven. Runs 12 and 14 were performed in a conventional electric oven in order to provide some data for comparison.
The commentary statement is next. The aim is to draw attention to the significance of the findings, not to explain or interpret them. The latter is the job of the discussion. Generally, the comments are factual, objectively-stated and very brief, as shown in these examples.
- Example: Live bacteria were identified in 32 of the 36 MEE samples tested. In 20 of these MEE only live bacteria were present, while in 12 both live and dead bacteria were identified.
- Example: An evaluation of Bartlett’s Test of Sphericity was found to be significant, thus confirming homogeneity of variance (X2(5050) = 13465.66, p<.0001).
- Example: As a result of this iterative process, 35 items were retained under eight factors, with no evidence of significant cross-loading.
- Example: The multimedia group had lower means, whereas the text-based group had higher means. As expected, the prior knowledge group had the lower scores on average.
- Example: It was found that high density could be achieved (up to 99.6% of the theoretical density) in the commercial microwave oven.
- Example: "To investigate whether bacteria within the MEE were viable despite low culture rates we used BacLight viability staining." Live bacteria were identified in 32 of the 36 MEE samples tested. In 20 of these MEE only live bacteria were present, while in 12 both live and dead bacteria were identified. Bacteria were present in extensive biofilms, microcolonies and in the planktonic state (Figure 1). Nucleic acid staining revealed extensive extracellular DNA stranding in 33 of the 36 MEE samples (Figure 1B and 1C). These extensive DNA structures frequently had biofilms associated. "To assess the association of the bacteria with an extracellular matrix, MEEs were stained with lectins." The 2 lectins bound the glycoproteins in the biofilm matrix, and these were associated with both the bacteria and the DNA strands (Figure 2). This association suggests the DNA may be a structural component of the biofilms within the MEE. ...
- Example: "Prior to the EFA, sample variance and sample size evaluations were conducted." An evaluation of Bartlett’s Test of Sphericity was found to be significant, thus confirming homogeneity of variance (X2(5050) = 13465.66, p<.0001). The Kaiser-Meyer Olkin measure of sampling adequacy (Kaiser, 1970) was .82, suggesting a highly adequate sample for analysis. "EFA (PAF with Oblique Rotation) was then conducted." The decision to retain factors was based on several criteria. First, factors were extracted based on EFA generated eigenvalues greater than 1 (95th percentile eigenvalues; Kaiser, 1960) and examination of the scree plot (Cattell, 1966). The eigenvalue results indicated the presence of 29 factors, while the screeplot revealed 10 factors. In order to further refine the number of extracted factors, Horn’s parallel analysis was used. Kaiser’s eigenvalues were compared to those generated by Horn’s Parallel analysis. Based on these results, a 10-factor model was identified. ...
- Example: "A stepwise method of analysis was used to reduce the number of items using the criteria described in section 2.4.1." As a result of this iterative process, 35 items were retained under eight factors, with no evidence of significant cross-loading. The final EFA matrix is presented in Table 5. The final 8-factor structure accounted for 59.45% of the overall scale variance. After rotation, factor 1 accounted for 20.06% of the variance (eigenvalue=7.0), factors 2 to 8 accounted for 8.6% (eigenvalue=3.0), 7.8% (eigenvalue=2.7), 6.3% (eigenvalue=2.2), 4.7% (eigenvalue=1.7), 4.2% (eigenvalue=1.5), 4.1% (eigenvalue=1.4), and 3.7% (eigenvalue=1.3) of the variance, respectively. …
- Example: "We started by counting the languages on the signs. We first categorised the signs by labelling them based on the concept of named languages, those that can be identified and enumerated." Table 1 below details the languages on 225 signs in our research setting. As indicated in Table 1, 128 signs contain monolingual messages, 88 bilingual messages and 2 multilingual messages. We recorded 7 instances of hybridity, where the status of at least one of the languages on the sign is not easily classifiable. Overall, more than half of the signs are monolingual and most of the monolingual signs display two forms of monolingualism: Vietnamese (65) and English (54). "We supplemented this with a second quantitative analysis to enable us to focus on the dynamic nature of frequently occurring language displays in different types of businesses in our research setting. …"
Writing the results section
Write the results section in the past tense as, by the time of writing it up, the experiment or study is over.
If there are secondary studies and sub-group analyses in your study, discuss the primary findings first, then the secondary findings, and then the findings from the sub-group analyses. This is done in the following examples below: the main findings (first "passage with double quote marks") is followed by the secondary findings (second "passage with double quote marks"), if applicable.